Reading and manipulating structures in R#
In order to read and manipulate protein structure information in R we will be using the bio3d R package developed by the Grant Lab. The package website has many tutorials on how to use the package for diverse applications and it is a good resource for anyone wanting to learn more on this topic. Once installed, the read.pdb() function can be used to directly fetch and import a protein structure from the PDB id code. In order to load the same 5J5X structure as above the following code would be needed:
Please note that we preinstalled all the R-packages on the server. Please do not install them again and just use the library function to load the packages.
# if not previously used, the install command will install the package for use. It can take a few minutes to install
install.packages("bio3d", dependencies=TRUE)
# use the bio3d library
library(bio3d)
# fetch the PDB structure with a PDB code id
pdb <- read.pdb("5J5X")
The object “pdb” now stores the information regarding the structure of the protein. Simply inputting the object name in R gives back a summary about the protein structure such as the number of atoms or the amino-acid sequence.
The object “pdb” now stores the information regarding the structure of the protein. Simply inputting the object name in R gives back a summary about the protein structure such as the number of atoms or the amino-acid sequence.
pdb

Call:  read.pdb(file = "5J5X")

        Total Models#: 1
             Total Atoms#: 2954,  XYZs#: 8862  Chains#: 2  (values: A B)

             Protein Atoms#: 2822  (residues/Calpha atoms#: 342)
             Nucleic acid Atoms#: 0  (residues/phosphate atoms#: 0)

             Non-protein/nucleic Atoms#: 132  (residues: 38)
             Non-protein/nucleic resid values: [ 6J9 (2), DAL (1), DAR (4), HOH (26), NH2 (1), SO4 (3), ZEU (1) ]

        Protein sequence:
             GSEQESVKEFLAKAKEDFLKKWESPAQNTAHLDQFERIKTLGTGSFGRVMLVKHKETGNH
             YAMKILDKQKVVKLKQIEHTLNEKRILQAVNFPFLVKLEFSFKDNSNLYMVMEYVPGGEM
             FSHLRRIGRFSEPHARFYAAQIVLTFEYLHSLDLIYRDLKPENLLIDQQGYIQVTDFGFA
             KRVKGRTWTLCGTPEYLAPEIILSKGYNKAVDWWALGVLIYEMAA...<cut>...FSEF

+ attr: atom, xyz, seqres, helix, sheet,
        calpha, remark, call
pdb$atom is a matrix that stores the ATOM information for every atom and can be queried and used as other matrices in R. For example to retrieve all the information stored for the first atom or the first 10 atoms you would type:
# Accessing the information for the first atom
pdb$atom[1,]

     type eleno elety  alt resid chain resno insert       x      y       z o      b segid elesy charge
     1 ATOM     1     N <NA>   GLY     A     9   <NA> -13.205 16.147 -12.716 1 116.91  <NA>     N   <NA>

# Accessing the information for the first 10 atoms
> pdb$atom[1:10,]

     type eleno elety  alt resid chain resno insert       x      y       z o      b segid elesy charge
     1  ATOM     1     N <NA>   GLY     A     9   <NA> -13.205 16.147 -12.716 1 116.91  <NA>     N   <NA>
     2  ATOM     2    CA <NA>   GLY     A     9   <NA> -12.596 14.801 -12.505 1 118.93  <NA>     C   <NA>
     3  ATOM     3     C <NA>   GLY     A     9   <NA> -12.070 14.608 -11.092 1 122.80  <NA>     C   <NA>
     4  ATOM     4     O <NA>   GLY     A     9   <NA> -12.774 14.895 -10.122 1 120.44  <NA>     O   <NA>
     5  ATOM     5     N <NA>   SER     A    10   <NA> -10.832 14.123 -10.983 1 128.71  <NA>     N   <NA>
     6  ATOM     6    CA <NA>   SER     A    10   <NA> -10.185 13.873  -9.687 1 129.38  <NA>     C   <NA>
     7  ATOM     7     C <NA>   SER     A    10   <NA>  -9.756 15.154  -8.955 1 130.17  <NA>     C   <NA>
     8  ATOM     8     O <NA>   SER     A    10   <NA>  -9.635 15.147  -7.726 1 128.71  <NA>     O   <NA>
     9  ATOM     9    CB <NA>   SER     A    10   <NA>  -8.968 12.956  -9.873 1 128.85  <NA>     C   <NA>
     10 ATOM    10    OG <NA>   SER     A    10   <NA>  -8.385 12.602  -8.629 1 127.12  <NA>     O   <NA>
In order to fetch specific elements of information for each atom you can use the appropriate indexes or also the column names. In order to get the “x” coordinates for the first 10 atoms you could select based on the 9th index or using the column name “x”.
> pdb$atom[1:10,9]
[1] -13.205 -12.596 -12.070 -12.774 -10.832 -10.185  -9.756  -9.635  -8.968  -8.385
> pdb$atom[1:10,"x"]
[1] -13.205 -12.596 -12.070 -12.774 -10.832 -10.185  -9.756  -9.635  -8.968  -8.385
Exercise 8.1
Using the commands described above fetch the x, y and z coordinates for the 6th atom, which corresponds to the alpha carbon of serine at position 10 of the protein position.
> pdb$atom[6,"x"]
[1] -10.185
> pdb$atom[6,"y"]
[1] 13.873
> pdb$atom[6,"z"]
[1] -9.687
The pdb object also holds information on secondary structure elements including the start and end positions alpha-helices and beta-sheets. This information is found in pdb$helix and pdb$sheet. The complete information for helices can be observed via:
> pdb$helix
$start
 10  39  76  84 127 139 201 206 217 242 262 288 294 301
$end
 32  41  82  98 136 160 205 211 234 253 273 293 298 307
$chain
 [1] "A" "A" "A" "A" "A" "A" "A" "A" "A" "A" "A" "A" "A" "A"
$type
 [1] "1" "5" "1" "1" "1" "1" "5" "1" "1" "1" "1" "1" "5" "1"
For example, pdb$helix$start and pdb$helix$end will return a vector of start and end amino-acid residue positions within the protein for all alpha-helices found within the structure. In order to find the length, in number of amino-acids, of the first alpha-helix one would type:
> pdb$helix$end[1]-pdb$helix$start[1]
22
The bio3d has the atom.select() function that allows you to find the indices of specific parts of the protein. This is important if you want to quickly create objects that contain subsets of the original structure. For example, the 5J5X structure has 2 different proteins, the kinase and a small binding molecule. These are encoded with different chains, in this case chain A and B. You can use the atom.select() function to select the atoms in a particular chain and then use the trim.pdb() function to create a smaller pdb object just with the atoms you want to select.
# Select chain B
bindex <- atom.select(pdb, chain="B")
# The indices are stored in bindex$atom and can be used to create a new object just with this chain
bpdb<-trim.pdb(pdb, bindex)
Exercise 8.2
Create a new structure object that has just the information for atoms from chain “A” from the previous object containing all atoms in 5J5X.
# Select chain A
aindex <- atom.select(pdb, chain="A")
# The indices are stored in bindex$atom and can be used to create a new object just with this chain
apdb<-trim.pdb(pdb, aindex)
The trim.pdb() function has several shortcuts that allow you to trim without having to explicitly provide the indices. For example you can trim by the chain using trim.pdb(pdb, chain=”A”). After manipulating the PDB in whatever way you have decided, you can then also save your new PDB to file using the write.pdb() function. For example, we could write out just the structure of chain A which is the kinase without the ligand.
> write.pdb(apdb, file="5J5X_chainA.pdb")
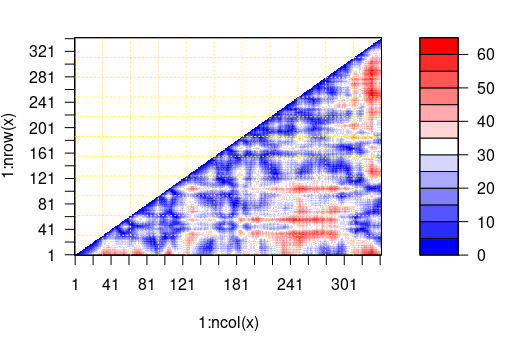
One very important and common manipulation required would be to calculate and use distances between atoms in 3D space for the structure of interest. The bio3d package includes a function to calculate distances for residues called “dm” which returns a matrix with distances in Angstroms between the selected atoms. It includes an option to provide indices for the atoms to use in the calculations which accepts also “calpha” to only calculate distances for the alpha carbons of each amino-acid. It is important to remember that indices for the matrix will not reflect the amino-acid position in the protein sequence.
#creating the distance matrix > mydist <-dm(pdb,inds=”calpha”) #Getting a vector with the distance in angstroms between residue 1 and all other residues > mydist[1,]
[1] NA 3.822987 5.597245 5.947519 8.116704 10.082438 11.241478 12.396722 14.321486 15.825920 (…)
# Distance in angstroms between residue 1 and residue 100 > mydist[1,100] [1] 41.00334 # Make a plot showing the distance between all residues plot(mydist)
Exercise 8.3
What is the largest distance measured between residue with index 12 and any other residue in the protein. Tip - the distance between a residue and itself is an NA value and these need to be removed when using the max() function. max( … ,na.rm=TRUE).
> max(mydist[12,],na.rm=TRUE)
[1] 46.09854