Tree inference#
The curated MSA serves as an input to construct and refine a phylogenetic tree, which can be considered a hypothesis of the evolutionary relationships between divergent species or genes represented in the genomes of divergent species. Several computational approaches exist that can be grouped into distance-matrix, maximum parsimony, maximum likelihood and Bayesian inference methods. The methods differ in their assumptions, algorithms and types of models used. Distance matrix methods are faster and computationally less expensive. However, the other methods are considered to produce more accurate results. By default, NGPhylogeny uses FastME as a distance-based programme to infer phylogenetic trees.
Tree visualisation#
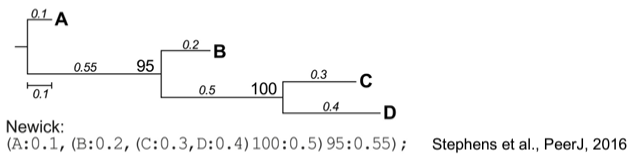
The Newick format is one of the most widely used formats to represent phylogenetic trees in computer-readable form. Several software packages exist to visualize and manipulate trees in different ways. For example, a cladogram displays the branching structure of a tree without branch length scaling, while in a phylogram, the branch lengths are proportional to the inferred evolutionary change. A tree can be unrooted, which makes no assumptions about ancestry. Although it is possible to root a tree on any of its branches, usually, it is rooted at the most recent common ancestor of all species/genes (leaves) in the tree. The layout of trees can be a rectangular or circular cladogram, for example.
Exercise 6.1#
Exercise 6.1
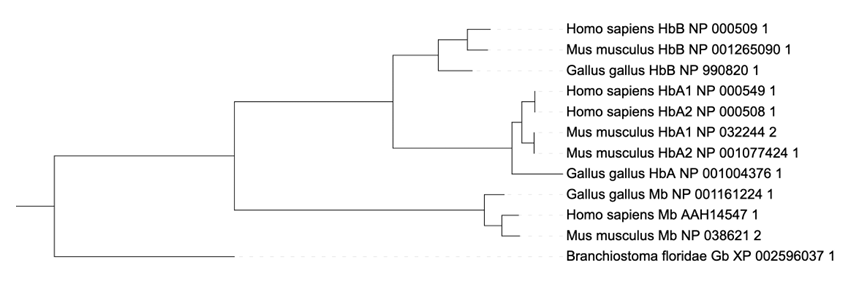
Please visit the website https://ngphylogeny.fr, select “One click workflows” under “Phylogeny Analysis” and upload (or copy/paste) the file /nfs/teaching/551-0132-00L/6_Phylogenetics/hemoglobin_homologs.faa, which contains homologous protein sequences of the globin gene family from vertebrates (human, mouse, chicken) and a non-vertebrate, the lancelet Branchiostoma floridae, as an outgroup. Once the workflow finishes, you can inspect the resulting tree directly in NGPhylogeny.
Save or copy the Newick-formatted tree data and upload it to iTOL (you can also export the Output Tree directly to iTOL), a powerful online tool for tree visualisation and annotation. Once the tree is displayed, click on any branch or leaf. A pop-up window will appear and under Editing/Tree structure, you can click on “Root the tree at midpoint”. The same can be achieved by clicking on the “Advanced” tab on the “Control panel” and clicking on “Midpoint root” under “Other functions” at the bottom. The tree is now displayed so that the last common ancestor of all sequences is represented as the root. Given this tree, HbA=hemoglobin alpha chain, HbB=hemoglobin beta chain, Mb=Myoglobin and Gb=Globin answer the following questions:
For any combination of the genes in the tree, determine whether they are orthologs or paralogs (for example, Homo-sapiens-HbA1 and Gallus-gallus-HbA are [orthologs|paralogs]).
HbA to HbB, HbA to Mb and HbA to Mb, and Ha genes within the same species are paralogs.
Mb genes from different species are orthologs.
HbB genes from different species are orthologs.
Without further analysis (e.g. testing gene neighborhood), it is not possible to determine if HbA1 or HbA2 genes in humans and mice are orthologous to the HbA gene in chicken.
Similarly, it is not possible to determine which pairs of HbA genes in humans and mice are orthologous to each other.
Importance of orthology: if you had only collected the sequences: Homo-sapiens-HbA1, Gallus-gallus-HbA and Mus-musculus-HbB, what would you have inferred about the relationships between human, mice and chicken (which organisms are more closely related to each other)?
Due to incomplete sampling/data, humans would appear to be more closely related to chicken than to mice.
Homo sapiens and Mus musculus have two isoforms of HbA genes (HbA1 and HbA2). The branch length between the isoforms is zero. Formulate a hypothesis when this gene duplication ocurred. What kind of additional data would you collect to test your hypothesis?
Sharing the exact same protein sequence suggest a recent (i.e., on an evolutionary time scale) duplication event of the gene; however, sometime before the last common ancestor of humans and mice existed. Testing for the copy number of the HbA gene in more distantly related organisms (e.g., mammals, tetrapods, vertebrates) could provide additional evidence when the duplication of the HbA gene occurred.