Thresholding#
Image segmentation is the process of detecting objects in an image
Global thresholding identifies pixel values above or below a particular threshold
The choice of threshold can introduce bias
Automated thresholding methods can often determine a good threshold based upon the image histogram and statistics – but only if certain assumptions are met
Thresholding is more powerful when combined with filtering & subtraction
Before we can measure anything in an image, we first need to detect it.
Sometimes, ‘detection’ might involve manually drawing regions of interest (ROIs). However, this laborious process does not scale very well. It can also be rather subjective.
In this chapter, we will begin to explore alternative ways to identify objects within images. An ‘object’ is something we want to detect; depending upon the application, an object might be a nucleus, a cell, a vessel, a person, a bird, a car, a helicopter… more or less anything we might find in an image.
This process of detecting objects is called image segmentation. If we can automate image segmentation, this is not only likely to be much faster than manually annotating regions but should also give more reproducible results.
Binary & labeled images#
Image objects are commonly represented using binary images.
Each pixel in a binary image can have one of two values. Usually, these values are 0 and 1. In some software (including ImageJ) a binary image has the values 0 and 255, but this doesn’t really make any difference to how it is used: the key point for our purposes is that one of the values represents the foreground (i.e. pixels that are part of an object), and the other value represents the background.
For the rest of this chapter, we will assume that our binary images use 0 for the background (shown as black) and 1 for the foreground (shown as white).
This is important: if we can generate a binary image in which all our objects of interest are in the foreground, we can then use this binary image to help us make measurements of those objects.
One way to do this involves identifying individual objects in the binary image by labeling connected components. A connected component is really just a connected group of foreground pixels, which together represent a distinct object. By labeling connected components, we get a labeled image in which the pixels belonging to each object have a unique integer value. All the pixels with the same value belong either to the background (if the value is 0) or to the same object.
If required, we can then trace the boundaries of each labeled object to create regions of interest (ROIs), such as those used to make measurements in ImageJ and other software.

Examples of a grayscale (blobs.gif), binary and labeled image. In (C), each label has been assigned a unique color for display. In (D), ROIs have been generated from (C) and superimposed on top of (A). It is common to use a LUT for labeled images that assign a different color to each pixel value.#
For that reason, a lot of image analysis workflows involve binary images along the way. Most of this chapter will explore the most common way of generating a binary image: thresholding.

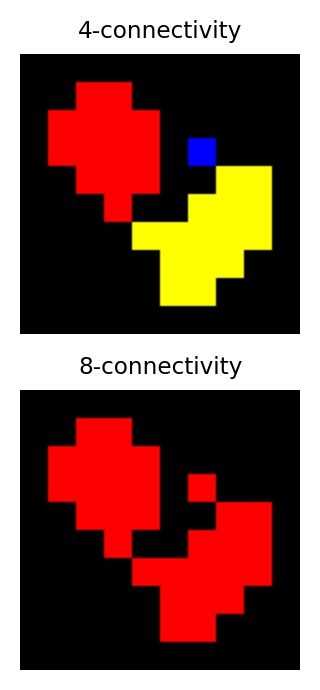
Identifying multiple objects in a binary image involves separating distinct groups of pixels that are considered ‘connected’ to one another, and then creating a ROI or label for each group. Connectivity in this sense can be defined in different ways. For example, if two pixels have the same value and are immediately beside one another (above, below, to the left or right, or diagonally adjacent) then they are said to be 8-connected, because there are 8 different neighboring locations involved. Pixels are 4-connected if they are horizontally or vertically adjacent, but not only diagonally.
The choice of connectivity can make a big difference in the number and sizes of objects found, as the example on the right shows (distinct objects are shown in different colors).
Global thresholding#
The easiest way to segment an image is by applying a global threshold. This identifies pixels that are above or below a fixed threshold value, giving a binary image as the output.
For a global threshold to work, the pixels inside objects need to have higher or lower values than the other pixels. We will look at image processing tricks to overcome this limitation later, but for now we will focus on examples where we want to detect objects having values that are clearly distinct from the background – and so global thresholding could potentially work.
Thresholding using histograms#
It’s possible to tell quite a lot about an image just by looking at its histogram.
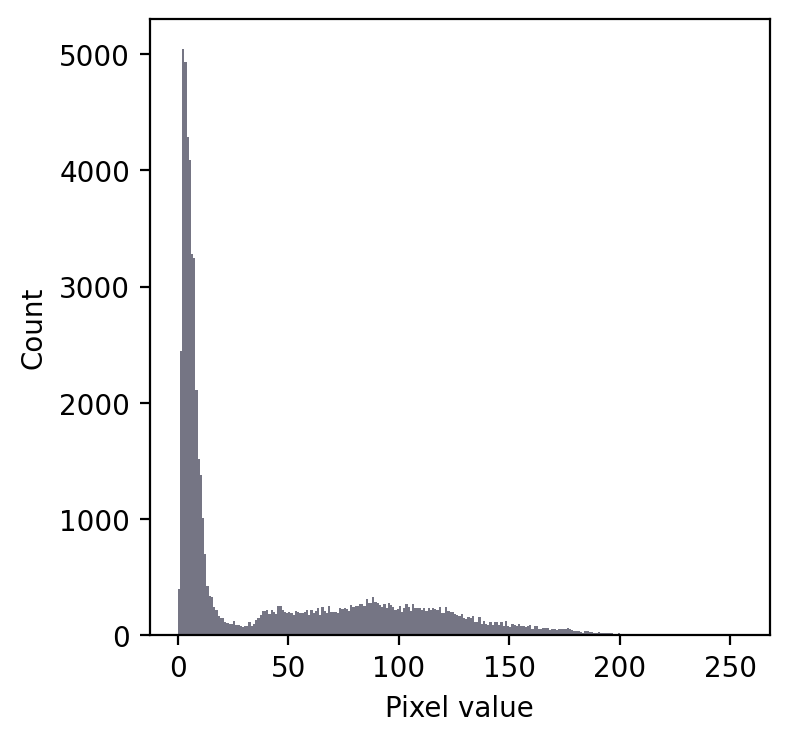
Take the following example:

Even without seeing the image, we can make some educated guesses about its contents.
Firstly, there is a large peak to the left and a much shallower peak to the right. This suggests that there are at least two distinct regions in the image. Since the background of an image tends to contain many pixels with similar values, I would guess that we might have an image with a dark background.
In any case, a threshold around 20-25 looks like it would be a good choice to separate the regions… whatever they may be.
If we then look at the image, we can see that we have in fact got a fluorescence image depicting two nuclei. Applying a threshold of 20 does achieve a good separation of the nuclei from the background: a successful segmentation.

A simple fluorescence image containing two nuclei. We could determine a potentially useful threshold based only on looking at the histogram.#
Admittedly, that was a particularly easy example. We should try a slightly harder one.

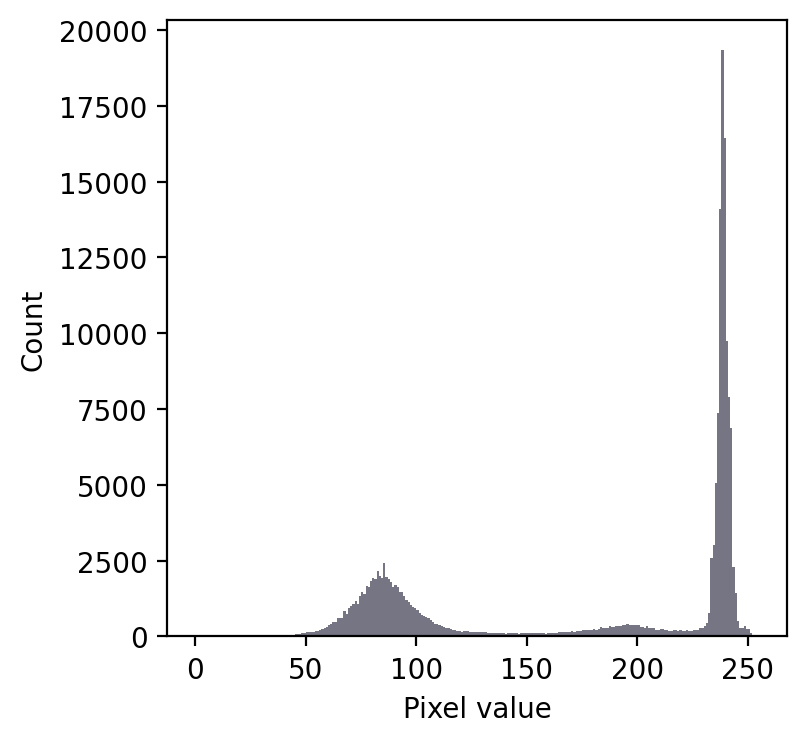
We still have a large peak, but this time it is towards the right. So I would guess a light background rather than a dark one.
But the problem is that we seem to have two shallower peaks to the left. That suggests at least three different classes of pixels in the image.
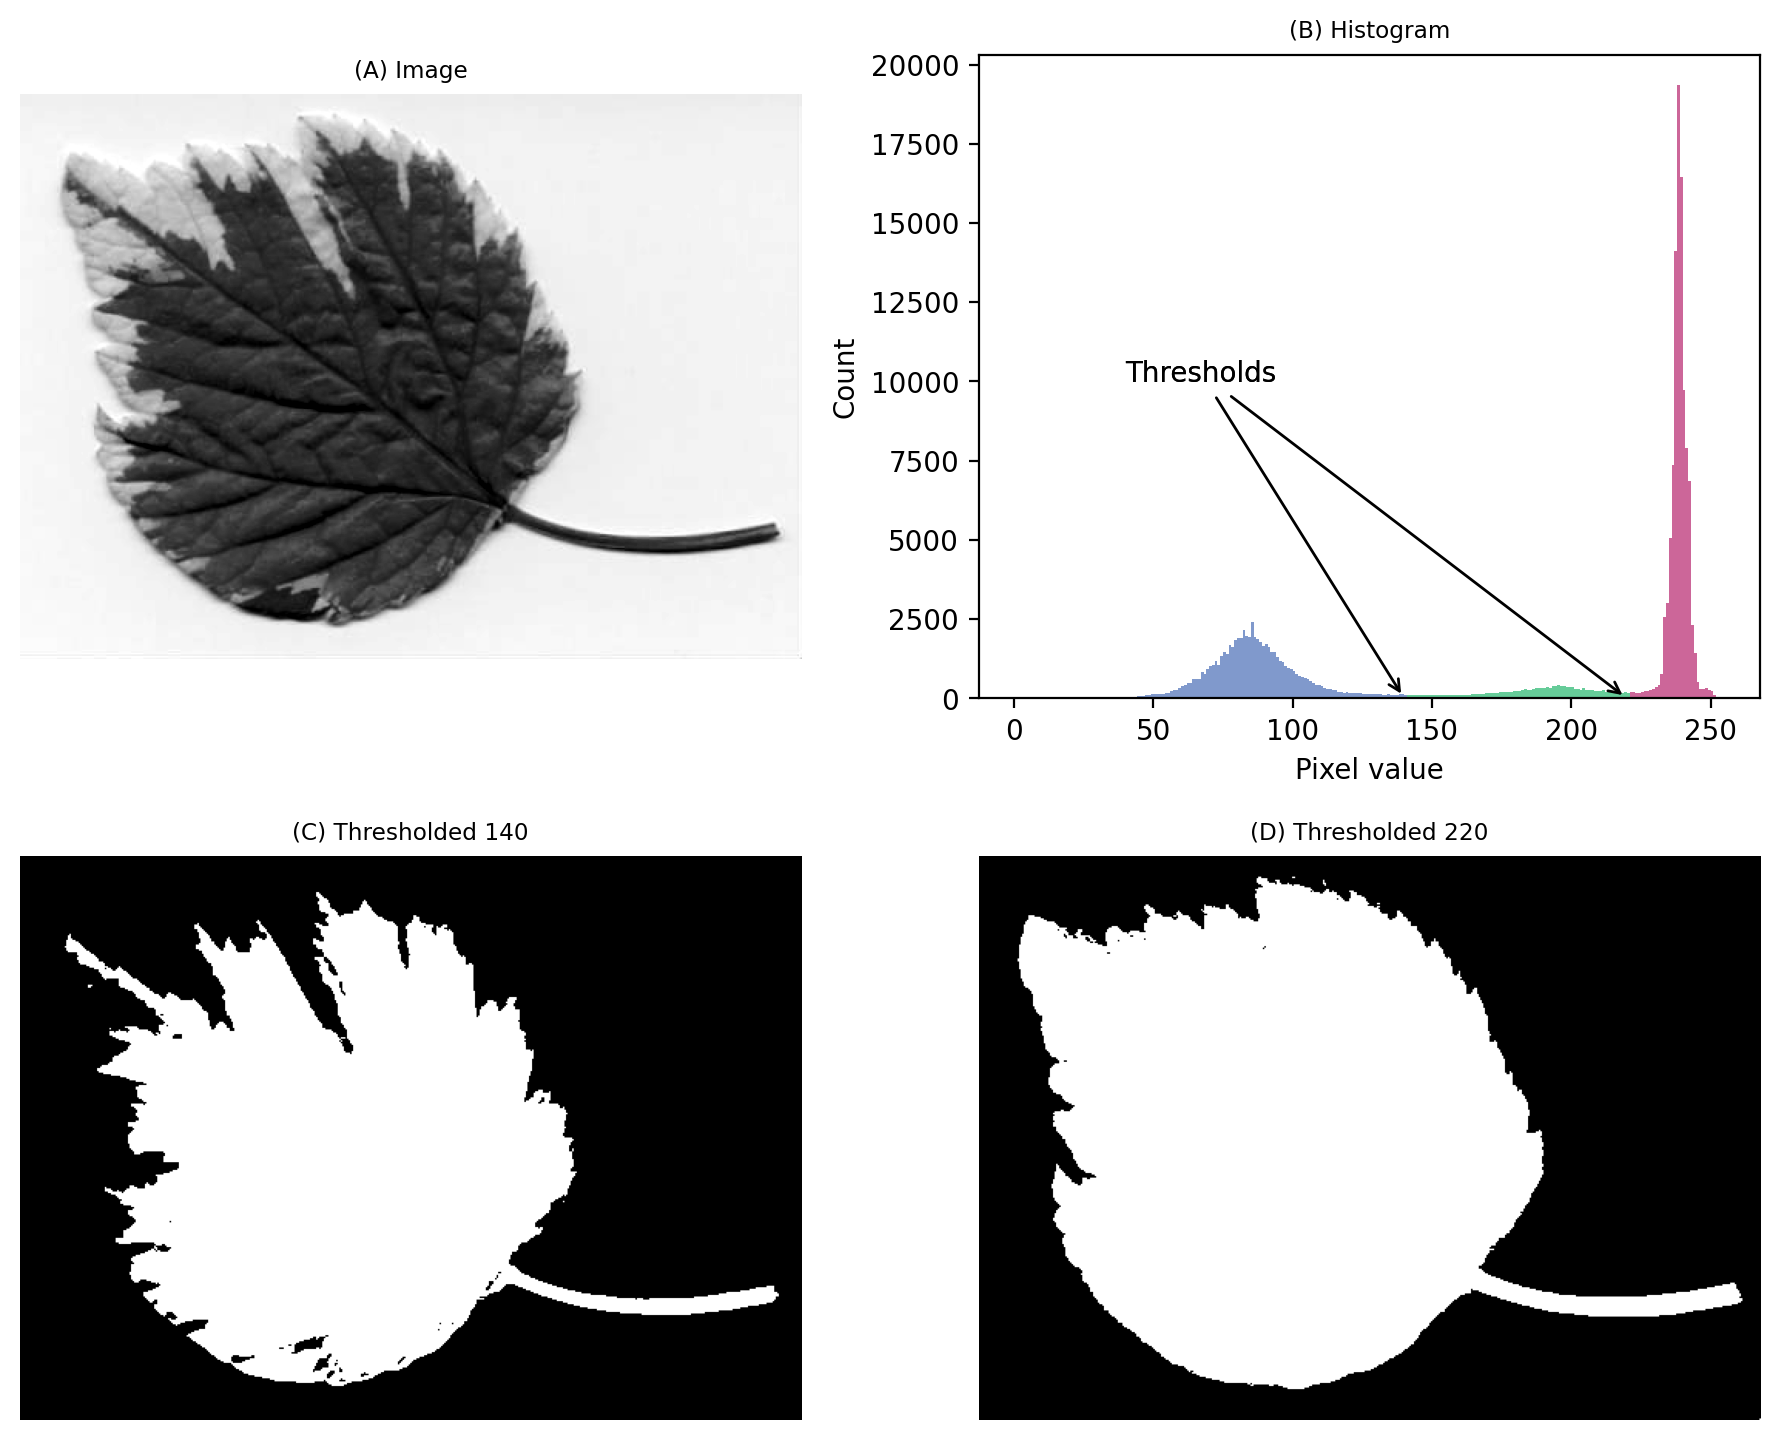
From visual inspection, we might suppose a threshold of 140 would make sense. Or perhaps around 220. It isn’t clear.
This time, we do need to look at the image to decide. Even then, there is no unambiguously ‘correct’ threshold. Rather, the one we choose depends upon whether our goal is to identify the entire leaf or rather just the darkest region.

An image where evaluating the histogram suggests two candidate thresholds. The ‘correct’ threshold depends upon the desired outcome. Note that here we identify pixels below the threshold value, rather than above, because the background is lighter.#
Histograms can help us choose thresholds. Histograms can be really useful when choosing threshold values – but we need to also incorporate knowledge of why we are thresholding.