Protein structure data
General information
Main objective
After an introduction to protein structures and structural bioinformatics we will introduce the .pdb protein data format. We will explore the Protein Data Bank (PDB) repository and how to search for protein structure data. We will discuss how three dimensional information about the structures of proteins is stored in a computer readable format. Finally, we will discover how this data can be manipulated computationally.
Learning objectives
Students can recognise and work with pdb formatted protein structure files
Students can search for protein structure data in appropriate online databases
Students are proficient with R to query protein structure data programmatically
Resources
This section requires the use of the R Studio: http://cousteau-rstudio.ethz.ch
We will also use Pymol (please make sure it is installed in your laptop): https://pymol.org/2/
Video
This section has a complementary video:
Introduction to Structural Biology
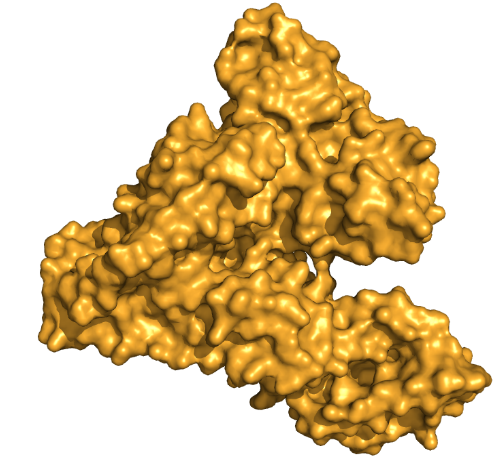
Proteins are the key effectors of the cell. They act as atomic scale molecular machines that have evolved to perform diverse and complicated actions. This includes the machines that generate energy, motors that move objects inside the cell, and all the machinery needed to duplicate cells and build a complex human body. A typical protein has a size on the order of 10nm or around 8 orders of magnitude smaller than a human. That is a similar difference between the height of a person and the diameter of planet earth. It is fascinating to imagine how a process of random variation and natural selection led to the existence of these molecular machines capable of building life at scales so much larger than themselves.
For the purpose of the lectures on structural bioinformatics it is important to remind yourselves about the basics of amino-acids and protein structure. Proteins are built up of amino-acids linked in a chain, forming a backbone with different amino-acid side-chains depending on the protein sequence. The folding and function of each protein depends on the exact sequence of amino-acids with each amino-acid in the chain differing only on the chemical properties of the side chain (e.g. positively or negatively charged, more or less hydrophobic). Sequential amino-acids tend to adopt specific secondary structural elements (e.g. alpha helix, beta-sheet) and different combinations of these elements result in different overall shapes. Different proteins can come together to form larger assemblies - protein complexes - which can often achieve more complex tasks.
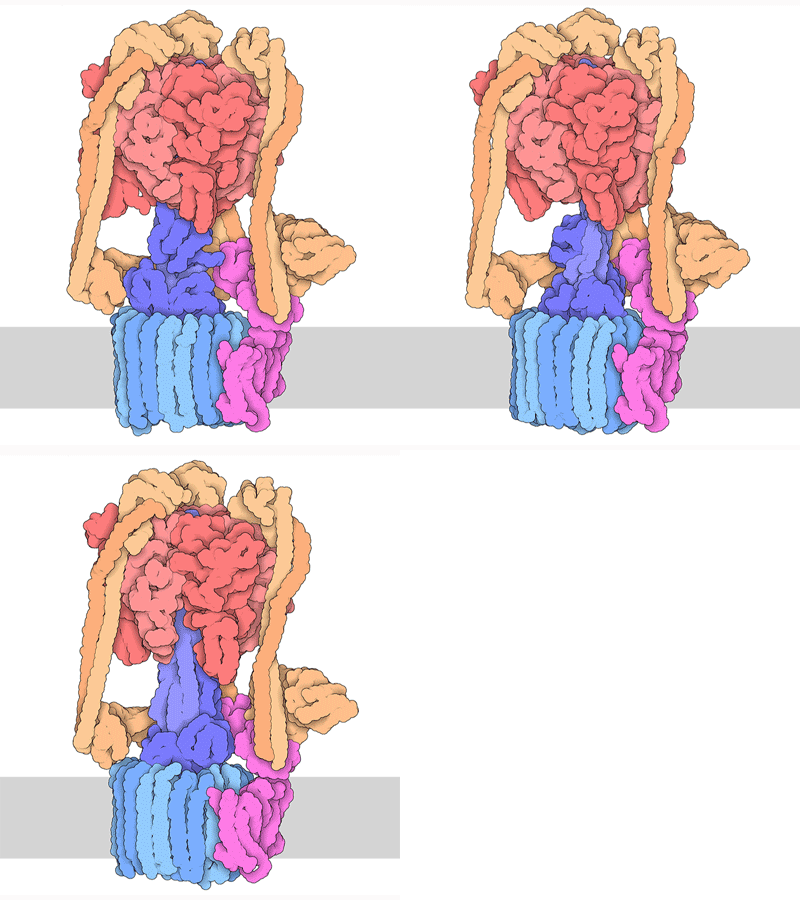
Proteins are highly dynamic and these motions are essential for their function. A useful way to think about this is to consider that a given protein can exist in different conformations, some more energetically favorable than others. Proteins can use energy stored in small-molecules like ATP to cycle through different conformations. The energy of different conformations is often linked with the folding of the protein and these ideas are often discussed as an energy landscape. Drug binding or mutations that cause disease often change the stability of specific protein conformations which can impact on the folding or function of the proteins.
The 3D structure of proteins and protein complexes is not only beautiful but critical for us to understand how proteins work, how to design drugs that can alter their function or to rationalize how mutations end up causing a disease.
Introduction to Structural Bioinformatics
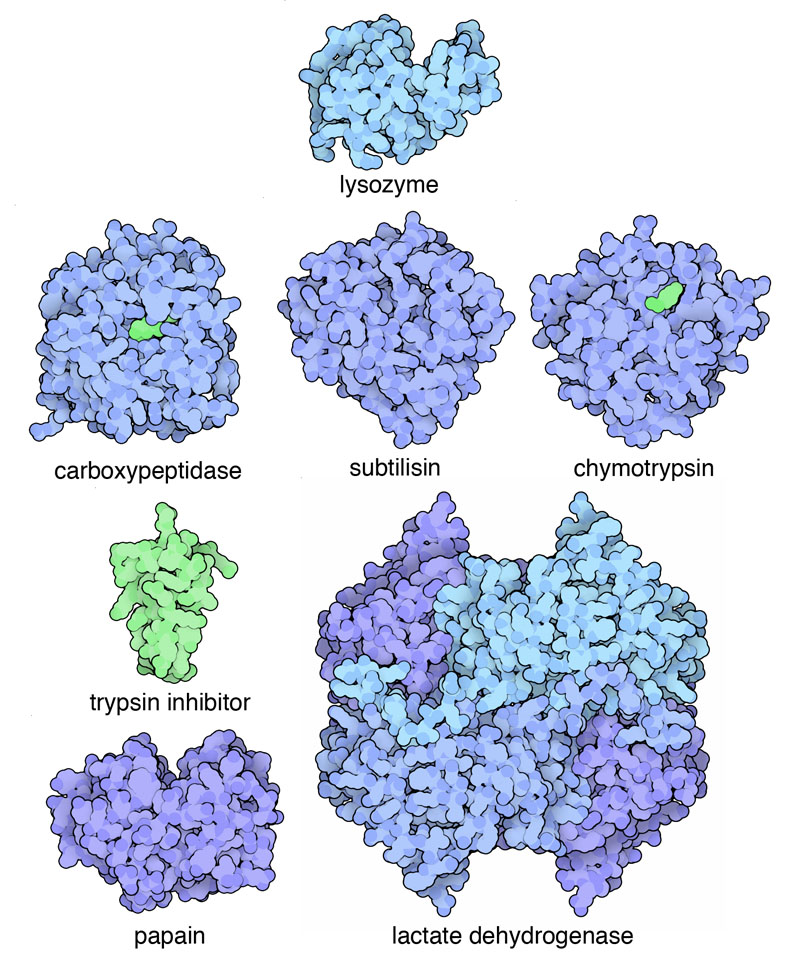
Structural bioinformatics has a long history and tradition within bioinformatics. Analysis of protein sequences and structures predates genome and gene expression analysis as protein related data were the first to be generated and compiled into collections. Margaret Oakley Dayhoff, the “mother” of bioinformatics was the first person to compile protein sequence information and one of the first to develop computational methods to analyze them. The repository of protein structures - the Protein Data Bank (PDB) - was started in 1971 with 7 structures.
Structural bioinformatics is a subfield of bioinformatics that focuses on predicting and analyzing three dimensional structural data, including but not exclusively protein structures. The types of problems that are dealt with include:
Predicting structure from sequence
Comparing structures
Studying the impact of mutations
Predicting differences in conformation and dynamics
Predicting function from structure (e.g. small molecule pockets)
etc.
The PDB repository and file format
The Protein Data Bank (https://www.rcsb.org) is the main database holding structural data but there are different entry points into PDB, including the PDB europe (https://www.ebi.ac.uk/pdbe).
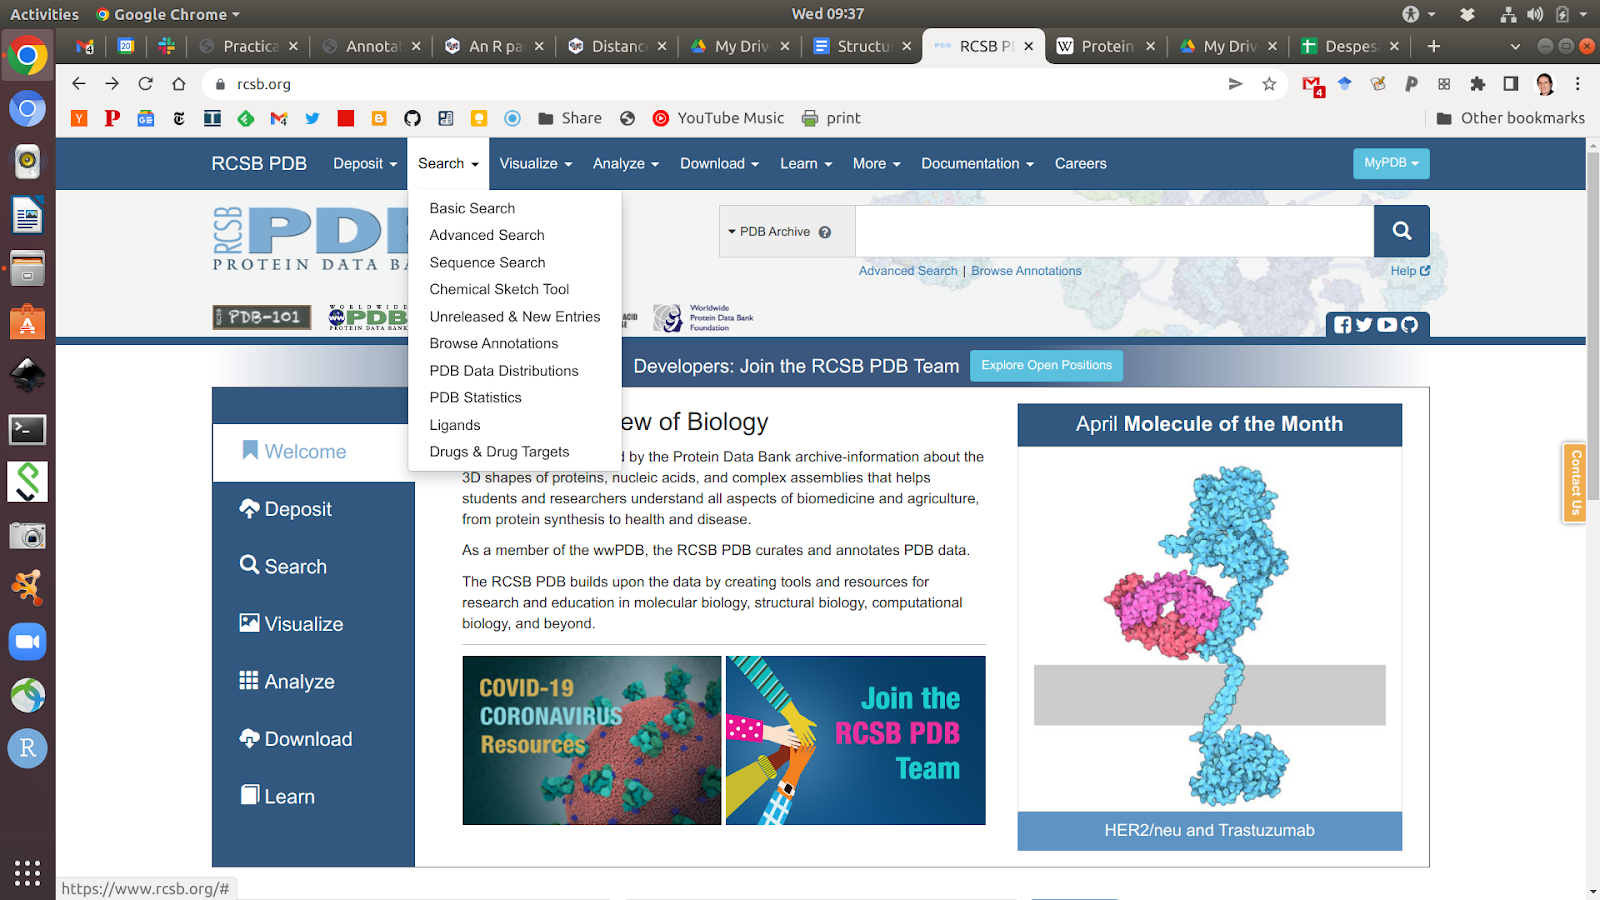
The PDB website allows you to search for protein structure information in different ways. You can do simple text queries for names or IDs of proteins or more advanced searches where you can restrict the search to specific species, types of experiments, the quality of the structure, the year it was produced, etc. It is also possible to search by sequence which will return you the structures of sequences that are very similar to the one provided.
As an example, we can find protein structures of sequences that are similar to the protein sequence for the human cAMP-dependent protein kinase (PRKACA). As discussed previously, you can find protein sequence data at the Uniprot database. Searching for human PRKACA leads you to a page where you can retrieve the protein sequence in fasta format.
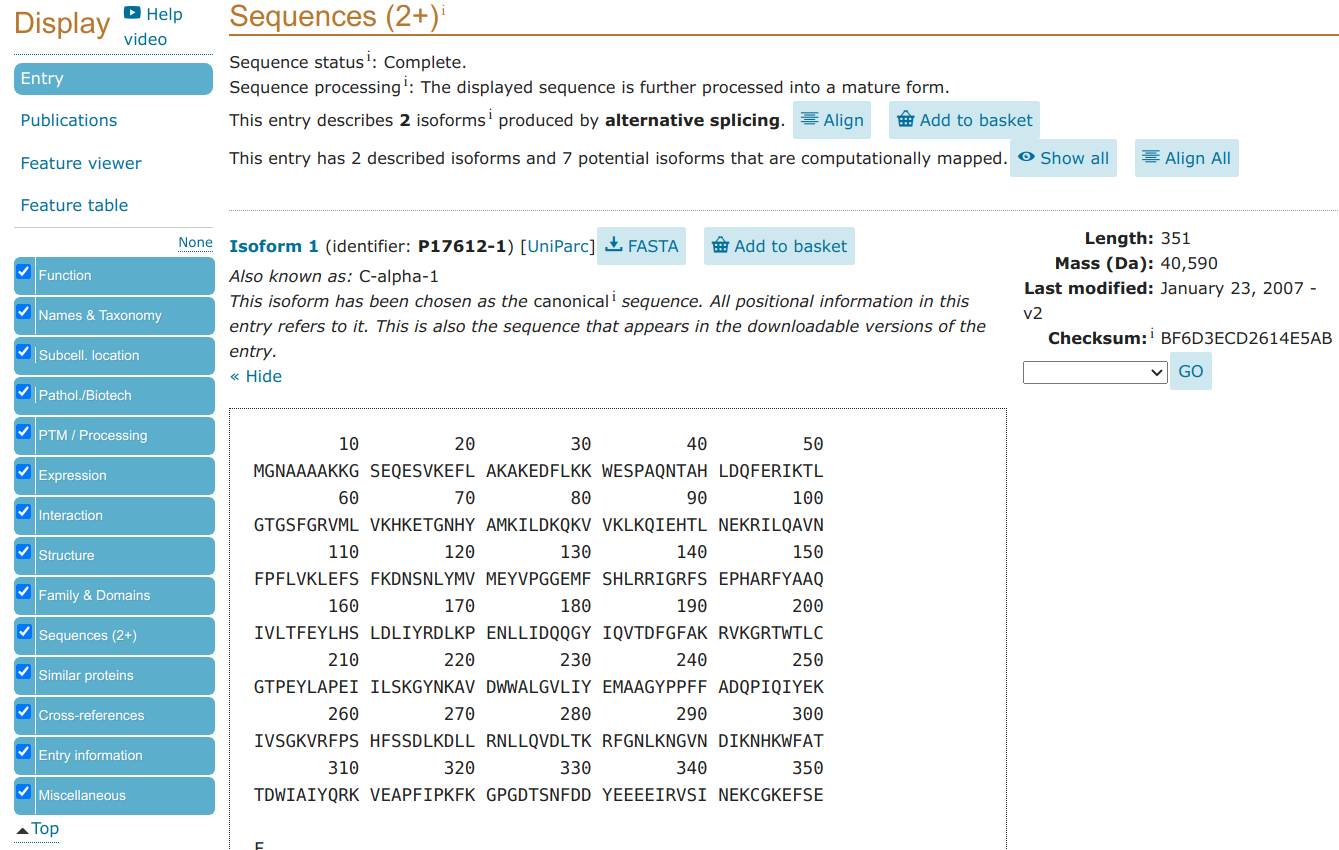
>sp|P17612|KAPCA_HUMAN cAMP-dependent protein kinase catalytic subunit alpha OS=Homo sapiens OX=9606 GN=PRKACA PE=1 SV=2
MGNAAAAKKGSEQESVKEFLAKAKEDFLKKWESPAQNTAHLDQFERIKTLGTGSFGRVML
VKHKETGNHYAMKILDKQKVVKLKQIEHTLNEKRILQAVNFPFLVKLEFSFKDNSNLYMV
MEYVPGGEMFSHLRRIGRFSEPHARFYAAQIVLTFEYLHSLDLIYRDLKPENLLIDQQGY
IQVTDFGFAKRVKGRTWTLCGTPEYLAPEIILSKGYNKAVDWWALGVLIYEMAAGYPPFF
ADQPIQIYEKIVSGKVRFPSHFSSDLKDLLRNLLQVDLTKRFGNLKNGVNDIKNHKWFAT
TDWIAIYQRKVEAPFIPKFKGPGDTSNFDDYEEEEIRVSINEKCGKEFSEF
The protein structure information for PRKACA is also already available in the same Uniprot webpage but we can pretend maybe that this was not the case because your particular protein sequence did not have a structure but there was a structure of homolog that would still be useful for your study.
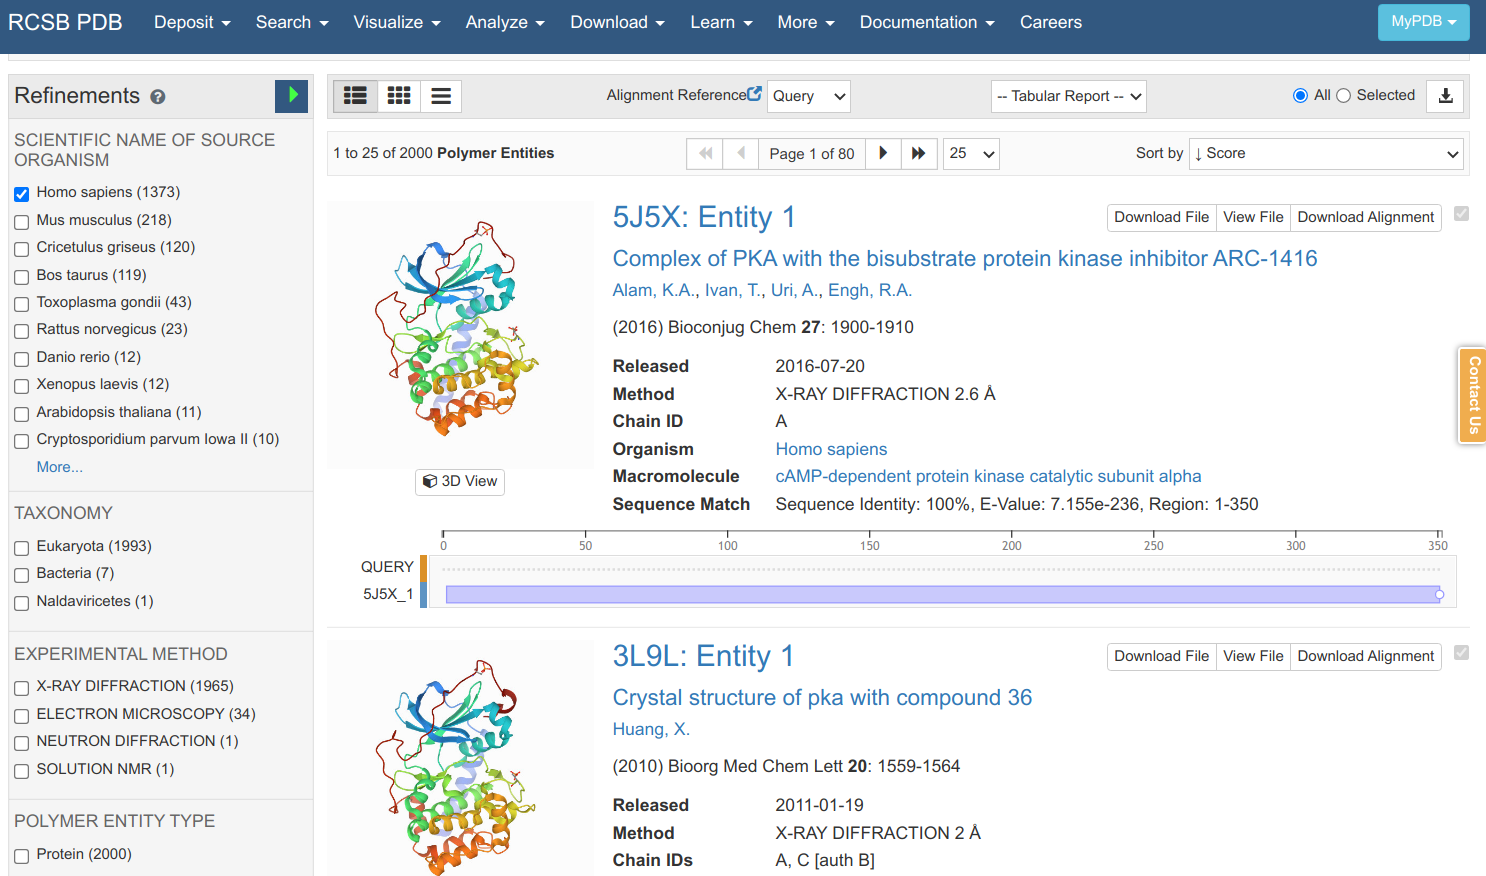
Searching in the PDB with that sequence retrieves many matches that can be further filtered according to the species, experimental method, structural resolution, etc. As it is a sequence search, it also shows you the sequence identity, E-value and how much the protein sequence is covered by the structural model. Clicking on the 5J5X entry leads to an entry specific page.
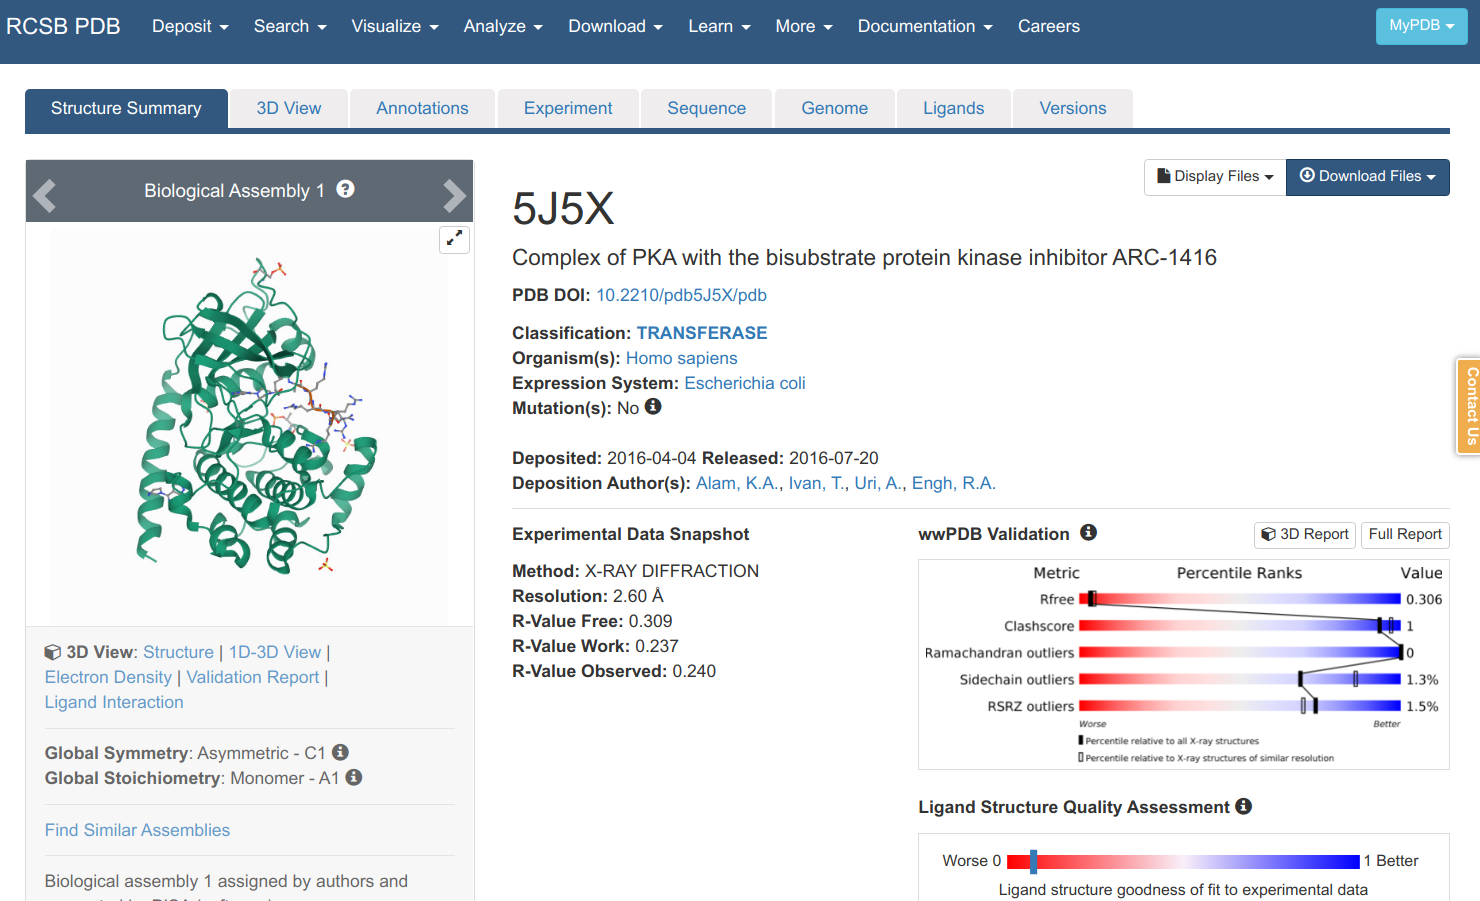
Here you can find information on the experiment, the publication describing the model (if any), and other information on the protein, small molecules etc. You can view a model of the structure by clicking “3D viewer” and retrieve a file that contains the structural information via “Download Files”. There are 2 main file formats that are used to communicate structural data in a standardized way: 1) the PDB format which is older and more human readable and 2) PDBx/mmCIF. If we download the PDB file format and open it in a text editor you can find the most important information for the lines starting with ATOM.
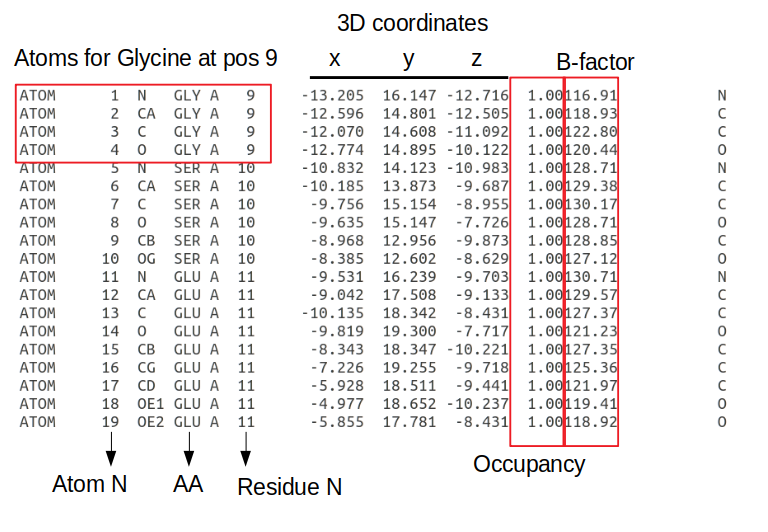
The information is written in a fixed length format where each information type is always at a specific number of characters away from the start of the line. Each line starting with ATOM has information about an atom including the atom number; the atom type (e.g. CA - the alpha carbon of the amino-acid); the amino-acid in a 3 letter code; the chain, the amino-acid residue in the protein sequence; the x/y/z 3D coordinates in angstroms; the occupancy (the fraction of molecules that have each of the conformations); the B-factor or temperature factor (the displacement of the atomic positions from an average value); and again the element name in a one letter code (e.g. C - carbon). The B-factor reflects to some extent how dynamic the residue is with higher numbers representing positions that are less constrained.
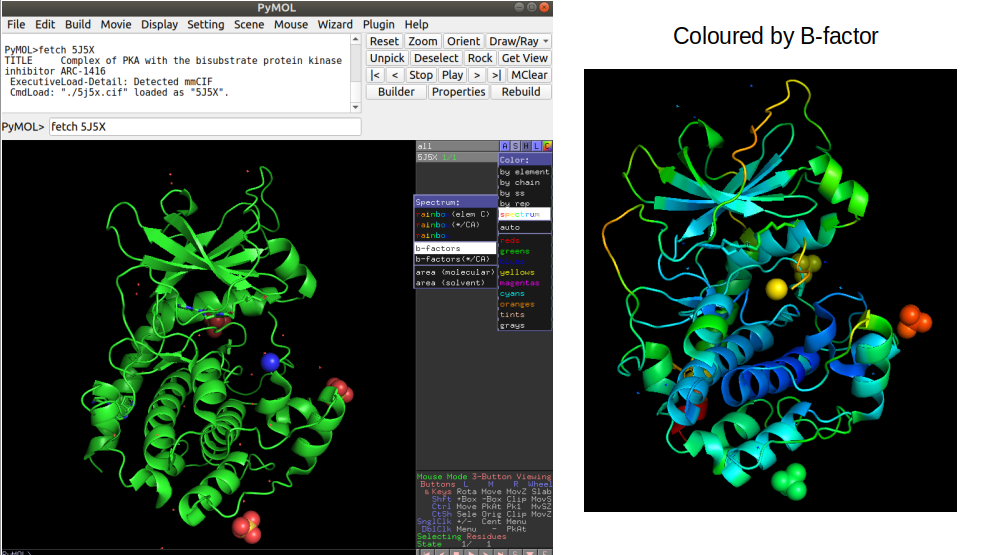
In order to visualize a structure Pymol is a useful tool that can be used to perform also some computational operations on selected examples. In pymol, it is possible to load a structure directly by typing “fetch” followed by the PDB id code. For example “fetch 5J5X” will load the PRKACA structure described above. It is possible to color the structure by the B-factor information which illustrates in this case how the lower B-factor scores (blue colors) tend to be within the core of the protein that should be less dynamic. It is important to become familiar with looking at protein structures in order to be critical about the outcome of computational analyses.
Reading and manipulating structures in R
In order to read and manipulate protein structure information in R we will be using the bio3d R package developed by the Grant Lab. The package website has many tutorials on how to use the package for diverse applications and it is a good resource for anyone wanting to learn more on this topic. Once installed, the read.pdb() function can be used to directly fetch and import a protein structure from the PDB id code. In order to load the same 5J5X structure as above the following code would be needed:
Please note that we preinstalled all the R-packages on the server. Please do not install them again and just use the library function to load the packages.
# if not previously used, the install command will install the package for use. It can take a few minutes to install
install.packages("bio3d", dependencies=TRUE)
# use the bio3d library
library(bio3d)
# fetch the PDB structure with a PDB code id
pdb <- read.pdb("5J5X")
The object “pdb” now stores the information regarding the structure of the protein. Simply inputting the object name in R gives back a summary about the protein structure such as the number of atoms or the amino-acid sequence.
pdb

Call:  read.pdb(file = "5J5X")

        Total Models#: 1
             Total Atoms#: 2954,  XYZs#: 8862  Chains#: 2  (values: A B)

             Protein Atoms#: 2822  (residues/Calpha atoms#: 342)
             Nucleic acid Atoms#: 0  (residues/phosphate atoms#: 0)

             Non-protein/nucleic Atoms#: 132  (residues: 38)
             Non-protein/nucleic resid values: [ 6J9 (2), DAL (1), DAR (4), HOH (26), NH2 (1), SO4 (3), ZEU (1) ]

        Protein sequence:
             GSEQESVKEFLAKAKEDFLKKWESPAQNTAHLDQFERIKTLGTGSFGRVMLVKHKETGNH
             YAMKILDKQKVVKLKQIEHTLNEKRILQAVNFPFLVKLEFSFKDNSNLYMVMEYVPGGEM
             FSHLRRIGRFSEPHARFYAAQIVLTFEYLHSLDLIYRDLKPENLLIDQQGYIQVTDFGFA
             KRVKGRTWTLCGTPEYLAPEIILSKGYNKAVDWWALGVLIYEMAA...<cut>...FSEF

+ attr: atom, xyz, seqres, helix, sheet,
        calpha, remark, call
pdb$atom is a matrix that stores the ATOM information for every atom and can be queried and used as other matrices in R. For example to retrieve all the information stored for the first atom or the first 10 atoms you would type:
# Accessing the information for the first atom
pdb$atom[1,]

     type eleno elety  alt resid chain resno insert       x      y       z o      b segid elesy charge
     1 ATOM     1     N <NA>   GLY     A     9   <NA> -13.205 16.147 -12.716 1 116.91  <NA>     N   <NA>

# Accessing the information for the first 10 atoms
> pdb$atom[1:10,]

     type eleno elety  alt resid chain resno insert       x      y       z o      b segid elesy charge
     1  ATOM     1     N <NA>   GLY     A     9   <NA> -13.205 16.147 -12.716 1 116.91  <NA>     N   <NA>
     2  ATOM     2    CA <NA>   GLY     A     9   <NA> -12.596 14.801 -12.505 1 118.93  <NA>     C   <NA>
     3  ATOM     3     C <NA>   GLY     A     9   <NA> -12.070 14.608 -11.092 1 122.80  <NA>     C   <NA>
     4  ATOM     4     O <NA>   GLY     A     9   <NA> -12.774 14.895 -10.122 1 120.44  <NA>     O   <NA>
     5  ATOM     5     N <NA>   SER     A    10   <NA> -10.832 14.123 -10.983 1 128.71  <NA>     N   <NA>
     6  ATOM     6    CA <NA>   SER     A    10   <NA> -10.185 13.873  -9.687 1 129.38  <NA>     C   <NA>
     7  ATOM     7     C <NA>   SER     A    10   <NA>  -9.756 15.154  -8.955 1 130.17  <NA>     C   <NA>
     8  ATOM     8     O <NA>   SER     A    10   <NA>  -9.635 15.147  -7.726 1 128.71  <NA>     O   <NA>
     9  ATOM     9    CB <NA>   SER     A    10   <NA>  -8.968 12.956  -9.873 1 128.85  <NA>     C   <NA>
     10 ATOM    10    OG <NA>   SER     A    10   <NA>  -8.385 12.602  -8.629 1 127.12  <NA>     O   <NA>
In order to fetch specific elements of information for each atom you can use the appropriate indexes or also the column names. In order to get the “x” coordinates for the first 10 atoms you could select based on the 9th index or using the column name “x”.
> pdb$atom[1:10,9]
[1] -13.205 -12.596 -12.070 -12.774 -10.832 -10.185  -9.756  -9.635  -8.968  -8.385
> pdb$atom[1:10,"x"]
[1] -13.205 -12.596 -12.070 -12.774 -10.832 -10.185  -9.756  -9.635  -8.968  -8.385
Exercise 8.1
Using the commands described above fetch the x, y and z coordinates for the 6th atom, which corresponds to the alpha carbon of serine at position 10 of the protein position.
> pdb$atom[6,"x"]
[1] -10.185
> pdb$atom[6,"y"]
[1] 13.873
> pdb$atom[6,"z"]
[1] -9.687
The pdb object also holds information on secondary structure elements including the start and end positions alpha-helices and beta-sheets. This information is found in pdb$helix and pdb$sheet. The complete information for helices can be observed via:
> pdb$helix
$start
 10  39  76  84 127 139 201 206 217 242 262 288 294 301
$end
 32  41  82  98 136 160 205 211 234 253 273 293 298 307
$chain
 [1] "A" "A" "A" "A" "A" "A" "A" "A" "A" "A" "A" "A" "A" "A"
$type
 [1] "1" "5" "1" "1" "1" "1" "5" "1" "1" "1" "1" "1" "5" "1"
For example, pdb$helix$start and pdb$helix$end will return a vector of start and end amino-acid residue positions within the protein for all alpha-helices found within the structure. In order to find the length, in number of amino-acids, of the first alpha-helix one would type:
> pdb$helix$end[1]-pdb$helix$start[1]
22
The bio3d has the atom.select() function that allows you to find the indices of specific parts of the protein. This is important if you want to quickly create objects that contain subsets of the original structure. For example, the 5J5X structure has 2 different proteins, the kinase and a small binding molecule. These are encoded with different chains, in this case chain A and B. You can use the atom.select() function to select the atoms in a particular chain and then use the trim.pdb() function to create a smaller pdb object just with the atoms you want to select.
# Select chain B
bindex <- atom.select(pdb, chain="B")
# The indices are stored in bindex$atom and can be used to create a new object just with this chain
bpdb<-trim.pdb(pdb, bindex)
Exercise 8.2
Create a new structure object that has just the information for atoms from chain “A” from the previous object containing all atoms in 5J5X.
# Select chain A
aindex <- atom.select(pdb, chain="A")
# The indices are stored in bindex$atom and can be used to create a new object just with this chain
apdb<-trim.pdb(pdb, aindex)
The trim.pdb() function has several shortcuts that allow you to trim without having to explicitly provide the indices. For example you can trim by the chain using trim.pdb(pdb, chain=”A”). After manipulating the PDB in whatever way you have decided, you can then also save your new PDB to file using the write.pdb() function. For example, we could write out just the structure of chain A which is the kinase without the ligand.
> write.pdb(apdb, file="5J5X_chainA.pdb")
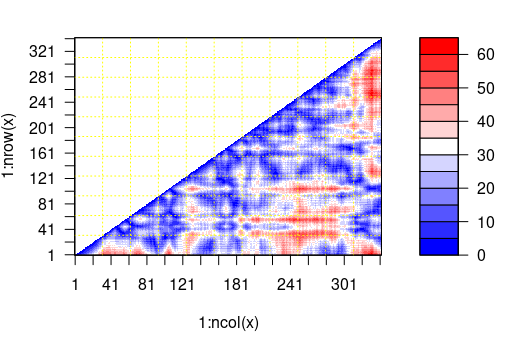
One very important and common manipulation required would be to calculate and use distances between atoms in 3D space for the structure of interest. The bio3d package includes a function to calculate distances for residues called “dm” which returns a matrix with distances in Angstroms between the selected atoms. It includes an option to provide indices for the atoms to use in the calculations which accepts also “calpha” to only calculate distances for the alpha carbons of each amino-acid. It is important to remember that indices for the matrix will not reflect the amino-acid position in the protein sequence.
#creating the distance matrix
> mydist <-dm(pdb,inds="calpha")
#Getting a vector with the distance in angstroms between residue 1 and all other residues
> mydist[1,]
  [1]        NA  3.822987  5.597245  5.947519  8.116704 10.082438 11.241478 12.396722 14.321486 15.825920 (...)
# Distance in angstroms between residue 1 and residue 100
> mydist[1,100]
[1] 41.00334
# Make a plot showing the distance between all residues
plot(mydist)
Exercise 8.3
What is the largest distance measured between residue with index 12 and any other residue in the protein. Tip - the distance between a residue and itself is an NA value and these need to be removed when using the max() function. max( … ,na.rm=TRUE).
> max(mydist[12,],na.rm=TRUE)
[1] 46.09854
In-class problems
In-class Problems Week 8
Using the information provided above use the bio3d library to load the 7FCD structure
This structure is very large because it has 3 copies of a very large protein. Before moving forward create a new structure object that only has the atoms from chain A.
What is the number of helices found in the structure of chain A (use the R length function) ?
What is the size in amino-acids of the first helix ?
Calculate the distances between all alpha carbons in the structure of chain A
What is the distance in angstroms between the amino-acids with the 10th and 20th indices ?